
I've sat across the table from business owners who were convinced their company was unsellable because their revenue chart looked like a heart monitor. Up one year, down the next. A great Q4 followed by a miserable Q1. A $1.2 million year sandwiched between two $800,000 years.
Here's what I tell every one of them: inconsistent revenue doesn't mean your business is worthless. It means your business requires a different approach to valuation, and it means the story you tell with your financials matters more than usual.
Most small businesses don't have perfectly smooth revenue lines. Seasonal businesses swing wildly between peak and off seasons. Businesses that lost revenue during COVID might have a two year dip in their trailing numbers. Companies that added a new service line or landed a big contract might show a sharp spike that looks like an anomaly. None of this makes a business unsellable. But all of it requires careful handling if you want to get a fair price.
Let me walk you through exactly how buyers, brokers, and appraisers value businesses with uneven revenue, and what you can do right now to position your business for the best possible outcome.
Why Inconsistent Revenue Scares Buyers (and What They're Really Worried About)
Buyers are not scared of imperfect numbers. They're scared of unpredictable cash flow after they sign the check.
When a buyer looks at your financials and sees revenue jumping from $900,000 to $1.3 million to $750,000 over three years, they're asking themselves one question: "If I buy this business, what will it earn next year?" If they can't answer that question with reasonable confidence, they either walk away or offer a price low enough to compensate for the risk.
The specific fears break down into a few categories:
Can the business cover debt payments? Most buyers finance acquisitions with SBA loans or seller financing. Loan payments are fixed. If revenue drops in year one, the buyer still owes the same monthly amount. A business that produced $200,000 in SDE last year but only $120,000 the year before makes lenders very nervous about the borrower's ability to service debt.
Is the business declining? A downward trend looks like a dying business. Even if you know the dip was caused by a specific event that won't recur, buyers don't have that context unless you give it to them. They see numbers going the wrong direction and assume momentum is against them.
Is the owner hiding something? Inconsistency in revenue can trigger suspicion. Buyers wonder if there's a problem the seller isn't disclosing. Did you lose a major customer? Did a competitor enter the market? Is the industry shrinking? Revenue swings invite questions, and unanswered questions kill deals.
Will the SBA lender approve the loan? SBA lenders typically want to see that a business can cover its debt payments by at least 1.25x based on historical earnings. When your earnings fluctuate significantly, the lender may use your worst year rather than your best year as the baseline. That lower baseline means less loan approval, which means a smaller buyer pool, which means a lower price.
Understanding these fears is the first step. The second step is showing buyers that their fears are either unfounded or manageable.
Broker insight: I've never had a deal fall apart because the revenue was uneven. Deals fall apart because the seller couldn't explain why the revenue was uneven. If you can tell a clear, documented story about every dip and spike, buyers will listen.
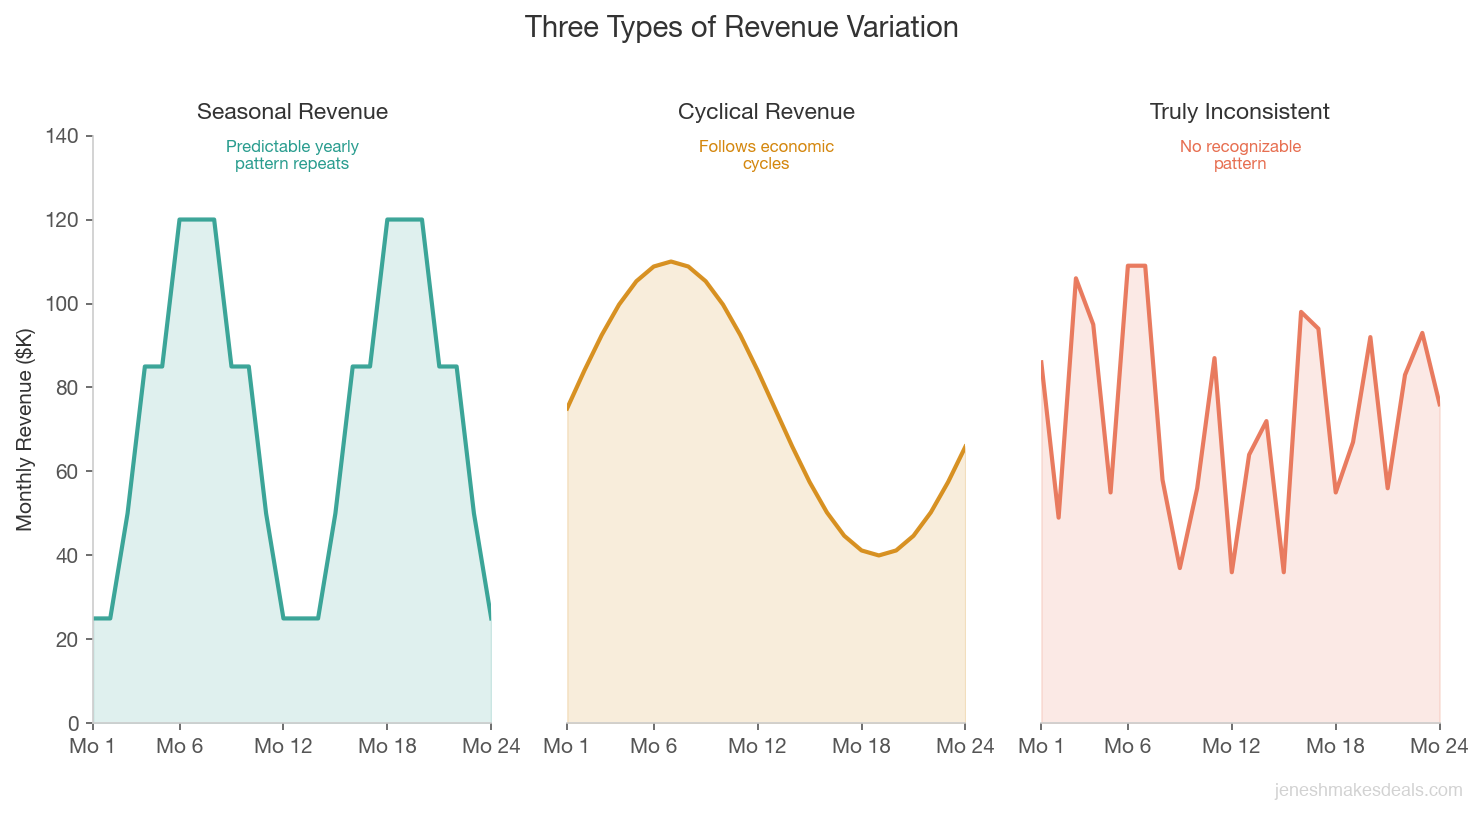
The Difference Between Cyclical, Seasonal, and Truly Inconsistent Revenue
Not all revenue fluctuation is created equal, and buyers know the difference. How your inconsistency is categorized dramatically changes how it affects your valuation.
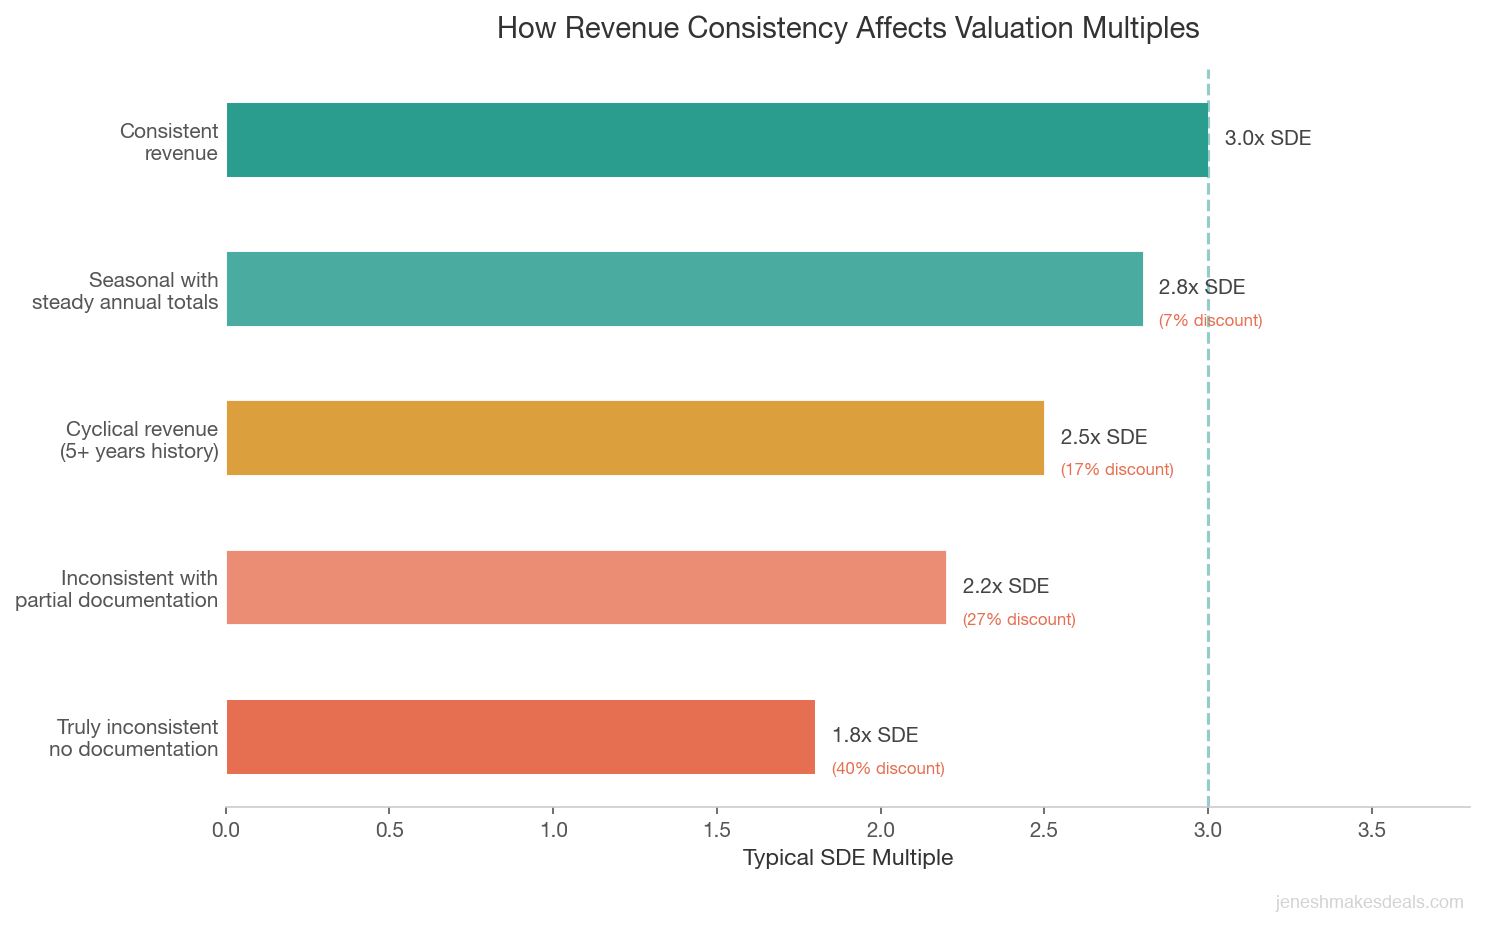
Seasonal revenue is predictable variation that follows the same pattern every year. A landscaping company does 70% of its annual revenue between April and October. A pool service business peaks in summer. A retail store does 40% of its sales in November and December. This isn't really "inconsistent" at all. It's a known, repeatable pattern. Buyers who understand the industry expect it, and seasonal businesses trade at multiples comparable to non seasonal businesses as long as the annual totals are steady.
Cyclical revenue is tied to broader economic or industry cycles. Construction businesses slow during recessions. Real estate related services follow housing market cycles. B2B companies that sell to a cyclical industry inherit that industry's ups and downs. Cyclical businesses are harder to value because the timing of cycles is unpredictable, but experienced buyers know how to model for cycles. The key is showing enough history to demonstrate a full cycle, usually five to seven years of financials.
Truly inconsistent revenue is variation that doesn't follow a recognizable pattern. Revenue was strong in 2022, dropped in 2023 for no clear reason, rebounded partially in 2024, and dipped again in 2025. This is the category that causes the most valuation pain, because buyers can't model what they can't predict.
| Factor | Seasonal Revenue | Cyclical Revenue | Truly Inconsistent Revenue |
|---|---|---|---|
| Pattern | Repeats the same way every year | Follows broader economic cycles | No recognizable pattern |
| Predictability | High | Moderate | Low |
| Typical Cause | Weather, holidays, industry norms | Recessions, housing cycles, commodity prices | Customer loss, owner decisions, random events |
| History Needed | 1 to 2 years | 5 to 7 years (full cycle) | 3 to 5 years with documentation |
| Impact on Valuation Multiple | Minimal if annual totals are steady | Moderate discount (10 to 20%) | Significant discount (20 to 40%) unless explained |
| Buyer Comfort Level | High, especially industry buyers | Moderate, experienced buyers adapt | Low without clear documentation |
The good news: most businesses that appear "truly inconsistent" actually have explainable causes for their revenue variation. The owner just hasn't done the work to identify and document those causes. A one time loss of a major customer, a failed marketing campaign, a staffing shortage that limited capacity, a lease issue that forced a temporary relocation. Once you identify the cause of each swing, you can reframe "inconsistent" as "explainable."
How Brokers Normalize Financials for Uneven Businesses
When I'm preparing a business with uneven revenue for sale, the first thing I do is normalize the financials. Normalization is the process of adjusting historical numbers to remove anomalies and show what the business would have earned under typical operating conditions.
Here are the main techniques:
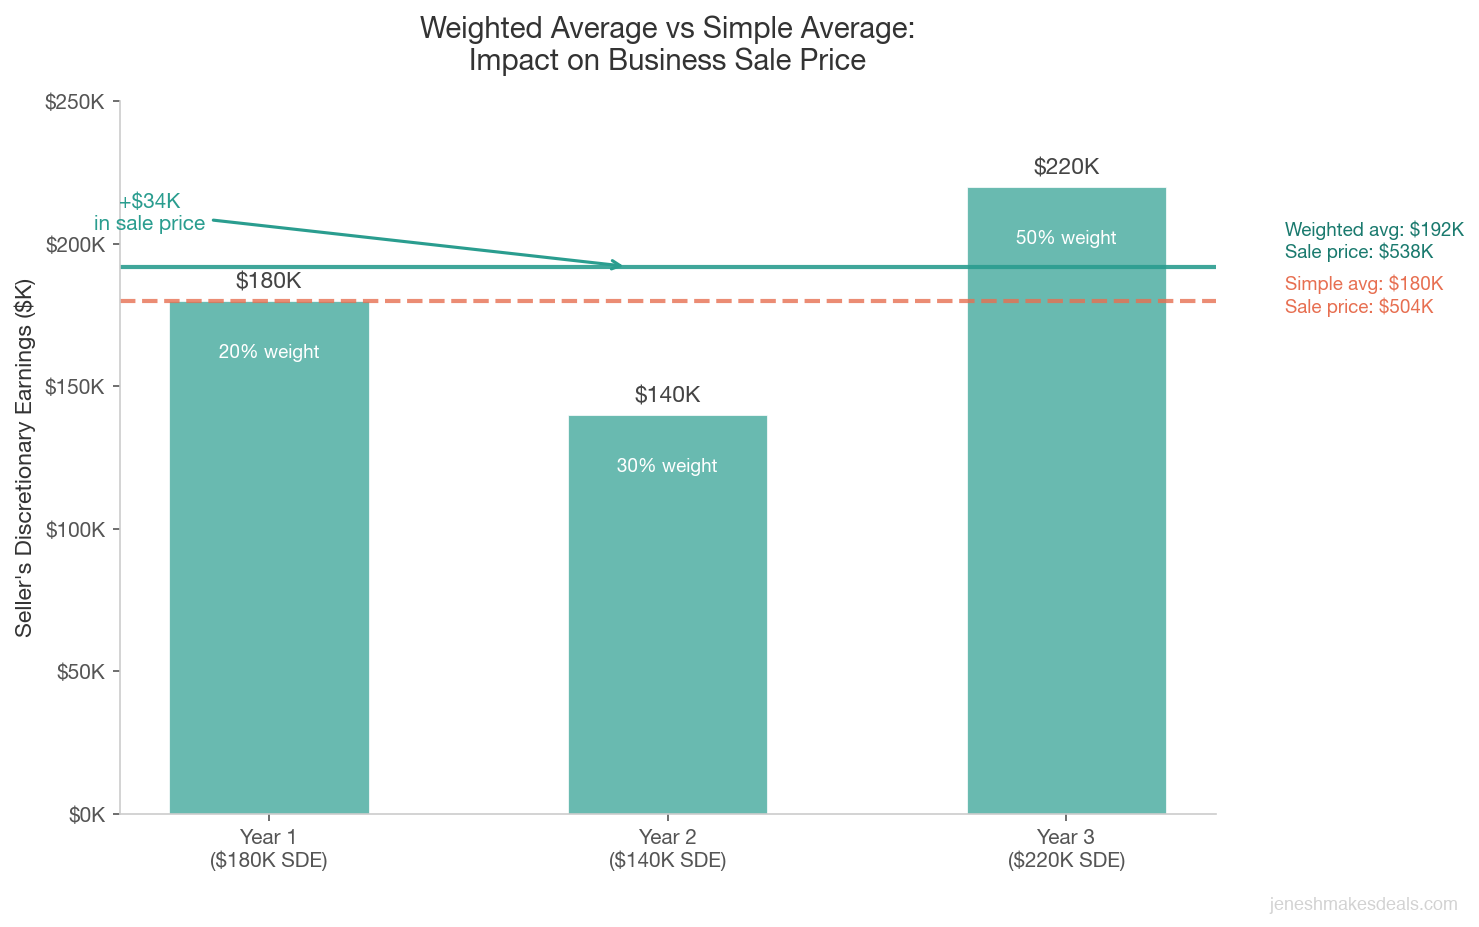
Weighted Averages
Instead of using a simple three year average, I'll weight recent years more heavily. If a business earned $180,000 in SDE three years ago, $140,000 two years ago, and $220,000 last year, a simple average gives you $180,000. But a weighted average that counts last year at 50%, the prior year at 30%, and two years ago at 20% gives you $192,000. That $12,000 difference represents $36,000 to $48,000 in sale price at typical multiples.
Weighted averages make sense when the business is on an upward or recovering trajectory, because they give more credit to recent performance without ignoring historical context. Buyers and lenders are generally comfortable with this approach.
Trend Line Analysis
For businesses with four or more years of history, you can plot revenue and SDE on a trend line to show the underlying direction separate from year to year noise. A business that shows revenue of $700K, $850K, $680K, $920K, and $980K over five years looks volatile when you list the numbers. But the trend line shows clear upward movement. The $680K year was the outlier, not the pattern.
Presenting a trend line alongside raw numbers gives buyers a different way to process your data. The key is being honest. Don't cherry pick which years to include. Show all the data and let the trend speak for itself.
One Time Event Adjustments
This is the most powerful normalization tool. If you can identify specific, documented reasons for a revenue dip or spike, you adjust for them. Revenue dropped $150,000 in 2024 because a construction project blocked your storefront entrance for four months? That's an adjustment. You had a $200,000 spike in 2023 because you filled a one time bulk order from a customer who has since gone out of business? That's an adjustment too.
The standard for these adjustments is documentation. You need evidence. Correspondence with the customer who placed the one time order. Photos or records of the construction that blocked access. Insurance claims from a weather event. Tax returns showing the financial impact. Without documentation, these adjustments look like excuses.
Key takeaway: The difference between a legitimate normalization adjustment and a made up excuse is paperwork. Start saving emails, invoices, photos, and records for anything that caused a revenue swing. By the time you're ready to sell, that documentation folder could be worth tens of thousands of dollars in sale price.
Removing COVID Year Distortion
This is still relevant in 2026 for businesses showing five year trailing financials. If your business was significantly impacted by COVID in 2020 or 2021, those years can drag down your averages. Most buyers and brokers now treat COVID impact as a documented one time event. If your business did $350,000 in SDE in 2019, dropped to $180,000 in 2020, recovered to $300,000 in 2021, and has done $370,000 to $400,000 since then, the 2020 and 2021 numbers should be footnoted and contextualized, not treated as representative of ongoing performance.
SDE Adjustments for Businesses with Revenue Swings
SDE, or seller's discretionary earnings, is the primary metric for valuing most small businesses. When revenue is inconsistent, the SDE adjustments become even more important, because you need to show buyers what normalized earning power looks like.
Standard SDE add backs apply regardless of revenue consistency: owner's salary, owner benefits, one time expenses, personal expenses run through the business, above market rent to a related landlord. But for businesses with uneven revenue, there are additional categories to consider.
Variable costs that tracked revenue dips. If revenue dropped by $200,000 in a particular year and your cost of goods sold dropped proportionally, the SDE impact was smaller than the revenue drop suggests. Make sure your presentation shows SDE alongside revenue so buyers can see that margins held steady even when the top line fluctuated.
Investments that depressed earnings temporarily. Did you hire two new employees in anticipation of growth? Did you invest $80,000 in new equipment that temporarily increased expenses without yet generating additional revenue? Did you spend $50,000 on a marketing campaign that started producing results in the following year? These are legitimate contexts for lower SDE in specific years.
Owner decisions that reduced revenue. This one is underappreciated. I worked with a business owner who stopped taking on new clients for six months while he dealt with a family health issue. His revenue dropped 25% that year. Once he resumed normal operations, it recovered fully. That revenue dip was an owner lifestyle choice, not a business performance issue. A new owner running the business full time would not have experienced that decline.
Want to see what your SDE actually is? Use our business valuation calculator to plug in your numbers and see where you stand.
How to Present Your Financials to Tell the Right Story
The difference between a business that sells at 2.8x SDE and one that sells at 2.0x SDE is often not the numbers themselves. It's the presentation.
When your revenue is inconsistent, you cannot hand a buyer three years of P&L statements and hope they figure it out. You need to build the narrative for them.
Create a Financial Summary Document
Put together a one to two page financial summary that shows:
- Annual revenue, gross profit, and SDE for the last five years (minimum three years)
- Explanations for any year where revenue or SDE deviated more than 15% from the prior year, with documentation references
- A normalized SDE calculation showing your adjustments and the methodology (weighted average, trend line, or adjusted average)
- Monthly revenue breakdown for the last two to three years, so buyers can see seasonal patterns and identify which months drove the annual variation
Use Graphs Strategically
A revenue chart with annotated explanations is one of the most effective tools I've seen in deal packages. Plot your annual revenue, then add callout boxes explaining each significant movement. "Lost key customer in Q2 2023, replaced with two new accounts by Q4 2023." "COVID shutdown March to June 2020." "Added commercial division in 2024, ramp up period reflected in H1 numbers."
This turns a scary chart into a readable story. Buyers can see what happened, why it happened, and how the business responded.
Lead with the Trend, Not the Average
If your business is on an upward trajectory despite year to year bumps, lead with that narrative. "Revenue has grown at a compound annual rate of 12% over the last five years, with year to year variation driven by [specific factors]." This frames inconsistency as noise around a positive signal, rather than the defining characteristic of the business.
Prepare for Follow Up Questions
Every buyer will ask about the inconsistency. Have your answers ready before they ask. Better yet, address it in the CIM (confidential information memorandum) so buyers who review the package already understand the context before they meet you.
Valuation Methods That Work Better for Inconsistent Revenue
The standard SDE multiple approach works well for businesses with stable earnings. For businesses with inconsistent revenue, other valuation methods can sometimes produce a more accurate (and often higher) result.
Discounted Cash Flow with Scenarios
DCF analysis projects future cash flows and discounts them back to present value. For inconsistent businesses, you can run multiple scenarios:
- Base case: Revenue continues at the normalized average, SDE stays at current margins. This might project $250,000 per year in cash flow.
- Upside case: Revenue follows the growth trend, new initiatives produce results. This might project $320,000 per year.
- Downside case: Revenue drops to its lowest recent level, margins compress slightly. This might project $160,000 per year.
Assign probabilities to each scenario (say 50% base, 25% upside, 25% downside) and the expected value is $245,000 per year. This approach gives buyers a range and a framework for thinking about risk, rather than a single number they have to accept or reject.
Asset Based Valuation as a Floor
For businesses with significant tangible assets (equipment, inventory, real estate, vehicles), an asset based valuation sets a floor price that's independent of revenue consistency. A landscaping company with $350,000 worth of trucks, mowers, trailers, and equipment has a minimum value regardless of what its revenue did last year.
This is especially useful if your revenue inconsistency has suppressed your SDE based valuation below what the assets alone are worth. It gives you a defensible minimum price point in negotiations.
Comparable Sales with Adjustments
Looking at what similar businesses actually sold for is always relevant. The key with inconsistent revenue is finding the right comparables. If your restaurant did $1.1 million in revenue last year but $800,000 the year before, you don't want to compare against restaurants that consistently do $1.1 million. You want comparables that had similar variation and see what multiples they achieved.
Industry databases like BizBuySell and DealStats track transaction data including revenue ranges. A broker with access to these databases can pull comps that match your business's profile, including the inconsistency.
| Valuation Method | Best For | Pros | Cons |
|---|---|---|---|
| Weighted Average SDE Multiple | Businesses trending upward or recovering | Gives more credit to recent performance | Still relies on historical data buyers may question |
| Discounted Cash Flow (DCF) | Businesses with projectable future earnings | Shows range of outcomes with probabilities | Requires assumptions buyers may challenge |
| Asset Based Valuation | Asset heavy businesses (equipment, inventory) | Sets a defensible floor price independent of revenue | Ignores earning power and goodwill |
| Comparable Sales | Any business with available transaction data | Grounded in real market outcomes | Hard to find comps with similar revenue variation |
| Segmented Valuation | Businesses with one stable and one volatile revenue stream | Values each stream at appropriate risk level | More complex to present and negotiate |
Not sure which valuation method fits your business? Get a free consultation and I'll walk you through the options specific to your situation.
Real Examples: How Inconsistent Revenue Played Out in Actual Deals
Let me share three real examples from businesses I've worked with. Details are changed to protect confidentiality, but the numbers and outcomes are representative.
Example 1: Seasonal Landscaping Business
The situation: A landscaping company in the Northeast with five year revenue history of $620K, $710K, $680K, $750K, and $820K. Monthly revenue ranged from $15,000 in January to $140,000 in July. The owner wanted to sell and was worried the seasonal swings would scare buyers.
The approach: We presented annual financials alongside a monthly revenue chart showing the consistent seasonal pattern. Revenue was seasonal, but the pattern repeated reliably every year. More importantly, annual revenue showed a clear upward trend. We calculated a weighted average SDE of $195,000 and priced the business at 2.7x, or $527,000.
The outcome: Three buyers made offers. The winning buyer was a competitor who already understood seasonal revenue patterns. The business sold for $510,000 with standard terms. The seasonal variation was a non issue because we framed it correctly and attracted the right type of buyer.
The lesson: Seasonal businesses aren't "inconsistent." They're predictable. Present the annual numbers, not the monthly ones, as your headline metric.
Example 2: Restaurant That Lost Revenue During COVID
The situation: A family restaurant with revenue history of $1.4M (2019), $620K (2020), $980K (2021), $1.3M (2022), $1.35M (2023), and $1.5M (2024). The trailing three year average looked great at $1.38M, but the five year average was dragged down by 2020 and 2021.
The approach: We footnoted 2020 and 2021 as COVID impacted years with specific documentation: government shutdown orders, reduced capacity mandates, and health department records. We presented two SDE calculations. The five year adjusted SDE (treating 2020 and 2021 as anomalies) was $245,000. The trailing three year SDE was $255,000. We used $250,000 as our normalized figure and priced at 2.5x, or $625,000.
The outcome: The buyer's SBA lender initially wanted to use the five year simple average, which included the COVID years and produced an SDE of $205,000. We provided the documentation and a letter explaining the adjustments. The lender accepted the normalized $250,000 figure. The business sold for $600,000.
The lesson: Documentation is everything. The lender didn't just take our word for it. They needed evidence that the revenue dip had a specific, non recurring cause. If you can't prove it, it's not an adjustment.
Example 3: Retail Store with One Big Customer
The situation: A specialty retail and wholesale business with revenue history of $900K, $1.4M, $1.1M, $1.5M, and $950K. The variation was almost entirely driven by a single wholesale customer who placed large orders unpredictably. In good years, this customer accounted for $400,000 to $500,000 in revenue. In off years, they accounted for $100,000 to $150,000.
The approach: We separated the financials into two revenue streams: retail (consistent at $750K to $850K per year) and wholesale (volatile). The retail operation alone had an SDE of $160,000 and was very stable. We valued the retail business at 2.8x ($448,000) and the wholesale revenue stream at 1.2x its average SDE contribution of $55,000 ($66,000), reflecting the uncertainty. Total asking price: $514,000.
The outcome: The buyer appreciated the separated presentation because it let them evaluate the stable core business independently from the volatile component. They offered $480,000, and we closed at $495,000. The buyer saw the wholesale customer as upside potential rather than a risk factor, because the retail base already justified most of the price.
The lesson: When one revenue stream is causing the inconsistency, separate it out. Value the stable base at a normal multiple and the volatile stream at a discounted multiple. This often produces a higher total than trying to value the whole business with a single depressed multiple.
Warning for sellers: Never let a buyer use your single worst year as the basis for their offer. If they point to one bad year and ignore the rest, that's a negotiation tactic, not a valuation method. Your job is to present normalized earnings backed by evidence so the conversation stays grounded in reality, not cherry picked data.
What You Can Do Right Now to Smooth Out Your Numbers Before Selling
If you're thinking about selling in the next 12 to 24 months and your revenue has been uneven, there are concrete steps you can take today.
Diversify Your Revenue Streams
If one product, one service, or one customer drives most of your variability, add stabilizing revenue. A landscaping company that adds snow removal creates year round revenue. A restaurant that adds catering creates a second income stream that may not correlate with dine in trends. The goal isn't to build an entirely new business. It's to add enough steady revenue that the variable portion is a smaller percentage of the total.
Lock in Recurring Revenue
Convert one time transactions to recurring contracts wherever possible. A cleaning company that shifts from one time jobs to monthly service contracts. An IT firm that moves from project based billing to managed service agreements. Recurring revenue is the single most powerful antidote to inconsistency. Even converting 30% of your revenue to recurring can meaningfully change how buyers perceive your stability.
Reduce Customer Concentration
If your inconsistency is driven by dependence on one or two big customers, start actively diversifying your customer base now. You won't fix this in three months, but in 18 months you can meaningfully shift the mix. Read more on this in my post on customer concentration risk.
Build a 12 Month Financial Narrative
Start keeping monthly notes on your financials right now. What caused that $30,000 revenue drop in March? A seasonal lull, a late payment from a client, a deliberate decision to turn down low margin work? When you have contemporaneous notes explaining every significant monthly variation, you'll have a powerful documentation package when it's time to sell.
Cut Discretionary Spending That Creates Noise
If you've been running personal expenses through the business, paying yourself inconsistent bonuses, or making irregular capital expenditures, consider standardizing these over the next year. Consistent expenses make it easier to isolate what caused revenue based earnings changes from what was just owner discretion.
Ready to start preparing your business for sale? Schedule a call and we'll build a 12 to 18 month plan specific to your situation.
When Inconsistent Revenue Actually Increases Value
Here's something most sellers don't realize: there are situations where revenue inconsistency works in your favor.
Strong Growth Trajectory
A business that went from $500K to $650K to $600K to $850K to $1.1M has inconsistent revenue. It also has a clear growth story. The $600K year looks like a setback, but the overall trend is strongly upward. Buyers will often pay a premium for growth trajectory because they're buying future earnings, not just current ones.
In this case, using a weighted average that emphasizes recent years, or even pricing based on trailing twelve month performance rather than a three year average, can be justified. A business doing $1.1M this year with strong momentum is worth more than a business that's done a steady $800K for five years, even though the growing business has more variation.
Post Investment Ramp Up
If you invested significantly in the business (new equipment, new location, new product line, new employees) and the investment is now producing results, the inconsistency reflects a business that's improving, not one that's unstable. The low years were investment years. The recent high years are the new baseline.
Show the investment alongside the revenue impact. "We invested $150,000 in a new production line in 2024. Revenue from that line was $80,000 in its first year and is tracking at $200,000 annually now." This context turns a revenue spike into evidence of smart capital allocation.
Rebounding from a Known Event
A business that dropped 30% during COVID and has fully recovered to pre pandemic levels is actually demonstrating resilience. A business that lost its biggest customer and rebuilt its pipeline within 18 months is demonstrating adaptability. These qualities are valuable. A buyer looking at the numbers without context sees volatility. A buyer who understands the story sees a business that can take a hit and bounce back.
The Buyer's Perspective: What Makes Them Comfortable with Uneven Numbers
After working with hundreds of buyers and sellers, I can tell you the specific things that make buyers comfortable purchasing a business with inconsistent revenue.
A clear explanation for every significant variation. Not "things were slow that year." Specific, documented explanations. "We lost the Henderson account in March, which represented $180,000 annually. We replaced that revenue with three new accounts by Q4 of the same year."
Evidence that the underlying business model is sound. Margins should be consistent even if revenue isn't. If your gross margin has been 45% to 50% every year regardless of whether revenue was $700K or $1.1M, that's a strong signal that the business operates well at different volume levels.
A diversified and growing customer base. If revenue inconsistency was caused by customer concentration and you've since diversified, that's a story of a problem that was identified and solved.
Realistic seller expectations. Buyers get suspicious when a seller with inconsistent revenue prices their business as if every year were the best year. Pricing based on normalized, weighted earnings signals honesty and financial sophistication.
Willingness to structure creatively. Sellers who are open to earnouts or seller financing tied to post sale performance demonstrate confidence in their business's ongoing viability. If you're willing to put skin in the game, buyers are more willing to accept your narrative about the numbers.
Putting It All Together: Your Valuation Roadmap
If your business has inconsistent revenue and you're thinking about selling, here's your action plan:
-
Pull five years of financial statements (P&L, balance sheet, tax returns). If you don't have five years, get at least three.
-
Calculate SDE for each year with all legitimate add backs. Make sure your methodology is consistent across years.
-
Identify the cause of every significant revenue swing (more than 10% year over year). Document each one with supporting evidence.
-
Classify your inconsistency. Is it seasonal, cyclical, or driven by specific events? Each category gets handled differently in valuation.
-
Calculate normalized SDE using the method that best fits your situation: weighted average for trending businesses, adjusted average for businesses with one time events, or segmented valuation for businesses with mixed stable and volatile revenue streams.
-
Build your financial narrative document. Annual summary, monthly breakdown, explanations for variations, normalized SDE calculation, and comparable sales data if available.
-
Get a professional valuation. A broker or appraiser with experience in your industry can validate your normalization approach and identify adjustments you missed. Our valuation calculators can give you a starting estimate, but a professional review is essential for businesses with complex financial histories.
Want to know what your business is actually worth, even with uneven revenue? Reach out for a confidential conversation about your specific situation. I've helped dozens of business owners with inconsistent financials find the right buyer at the right price. The numbers don't have to be perfect. They just have to tell a story that makes sense.
Related Articles

April 30, 2026
How Long Does It Really Take to Sell a Business
Most sellers are shocked by how long it takes. Here's the honest timeline from listing to closing, and what actually speeds things up.

April 26, 2026
How to Structure an Earnout That Works for Seller and Buyer
Most earnouts fail because they're poorly structured. Here's how to build earnout terms that protect both sides of the deal.

April 24, 2026
How to Value Intellectual Property in a Business Sale
Your IP could be worth more than your equipment. Learn how patents, trademarks, and trade secrets affect your business valuation.
About the Author
Jenesh Napit is an experienced business broker specializing in business acquisitions, valuations, and exit planning. With a Bachelor's degree in Economics and Finance and years of experience helping clients successfully buy and sell businesses, he provides expert guidance throughout the entire transaction process. As a verified business broker on BizBuySell and member of Hedgestone Business Advisors, he brings deep expertise in business valuation, SBA financing, due diligence, and negotiation strategies.
You might also be interested in
Free Business Calculators
Try our business valuation calculator and ROI calculator to estimate values and returns instantly.
How to Buy a Business Guide
Download our comprehensive free guide covering everything you need to know about buying a business.
Our Services
Explore our professional business brokerage services including valuations and buyer representation.
More Articles
Browse our complete collection of business brokerage insights and expertise.