
The average small business in America sold for 2.61x its annual cash flow last year [1]. That single number generated $7.95 billion in total enterprise value across 9,586 closed transactions in 2025 [1]. But here is what that average hides: a plumbing company and a car wash sitting on the same street, with the same revenue, can have wildly different business valuation multiples. The plumbing company trades at 2.51x SDE. The car wash trades at 4.99x. On $200,000 in SDE, that is the difference between walking away with $502,000 and walking away with $998,000.
I broker business sales every day. The question I hear more than any other is "what is my business worth?" The honest answer: it depends on your industry, your financials, your buyer pool, and about a dozen other factors. But it starts with knowing the right multiple for your industry and understanding where you fall within the range.
I sat with an HVAC owner in northern New Jersey last month who was convinced his business was worth 5x SDE because he read an article about PE firms buying home services companies. His actual number? Closer to 2.8x. He had no maintenance contracts, no management layer, and his financials were a mess. Knowing the average is not enough. You need to know what drives the range.
This post compiles 2026 business valuation multiples from BizBuySell, IBBA Market Pulse, GF Data, Peercomps, First Page Sage, Sica Fletcher, Capstone Partners, and more. Every number below comes from real transaction data or verified industry reports.
Five things to know right now:
- The market is stable but selective. BizBuySell's 9,586 closed deals in 2025 represent a 3% increase in total enterprise value year over year [1].
- Private equity dominates the mid market. PE firms accounted for 59% of all transactions in the $5M to $50M range, with 64% of those being horizontal add ons [2].
- Home services are on fire. HVAC, plumbing, landscaping, and pest control multiples are all trending up, driven by aggressive PE roll up strategies.
- Interest rates still matter. SBA 7(a) loan rates range from 9.75% to 14.75% in early 2026 [3]. The average SBA loan amount has dropped 38% since May 2021 [4].
- Seller financing is no longer optional. 62% of brokers call seller financing "very important," and 60% of winning LOIs in the $10M to $25M range included it [2].
SDE vs. EBITDA Multiples: Which One Applies to Your Business?
Before you look at a single number in this post, you need to understand which metric applies to your business. Getting this wrong will throw off your entire valuation.
SDE (Seller's Discretionary Earnings) captures the total economic benefit flowing to a single owner operator: net income plus your salary, benefits, and one time expenses you ran through the business. Deals under $2M in enterprise value are generally valued on SDE [2]. If your business does under $3M in revenue and you are the primary operator, buyers are looking at your SDE.
EBITDA is net income plus interest, taxes, depreciation, and amortization. The critical difference: EBITDA treats owner compensation as an operating expense at market rate. It assumes someone else could be hired to do your job. EBITDA becomes the standard metric when businesses have management teams in place and revenue over $3M.
| Metric | What It Includes | Typical Business Size | Typical Buyer |
|---|---|---|---|
| SDE | Net income + owner's salary + benefits + one time expenses | Under $3M revenue; owner operated | Individual buyers, first timers |
| EBITDA | Net income + interest + taxes + depreciation + amortization (owner salary treated as market rate expense) | Over $3M revenue; management team in place | PE firms, strategic acquirers, serial entrepreneurs |
One exception: professional services firms, medical practices, and legal practices often use SDE regardless of size [5]. SaaS businesses frequently use ARR (Annual Recurring Revenue) multiples instead of either [6].
Want to see where your business falls? Run a free valuation using our business valuation calculator to get a quick estimate. You can also try our listing price estimator to see what asking price your business could support.
2026 SDE Multiples by Industry
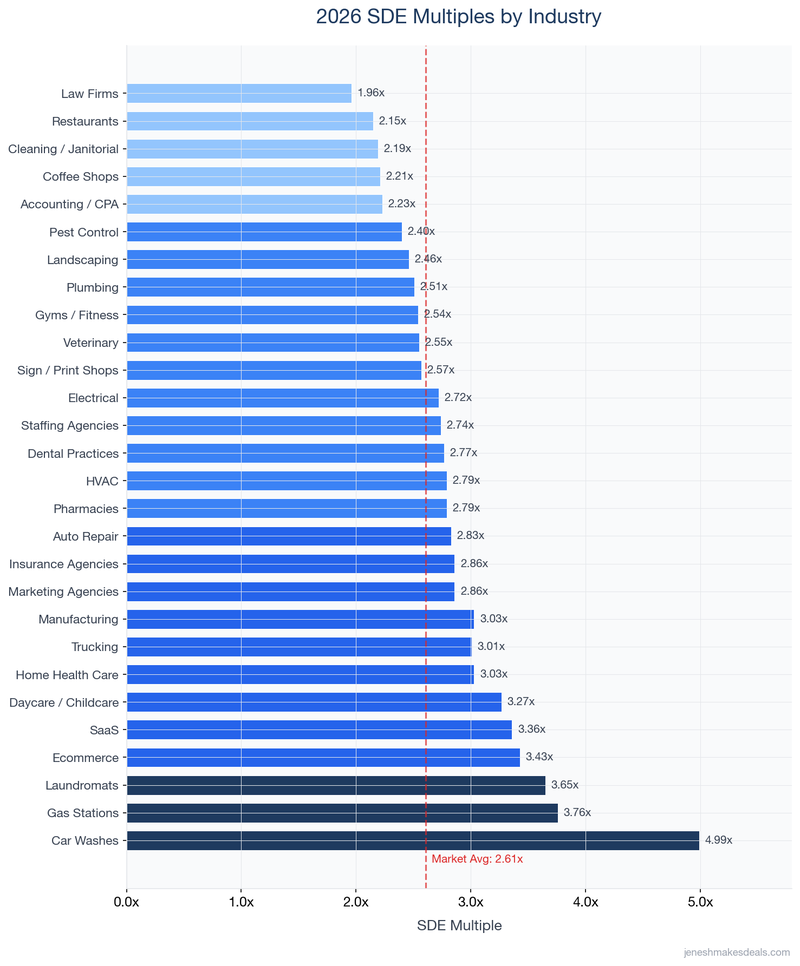
This is the table you came here for. The data covers businesses under $5M in revenue, sourced from BizBuySell's transaction database spanning Q1 2021 through Q4 2025 [7], supplemented by industry specific M&A reports.
| Industry | Avg SDE Multiple | Revenue Multiple | Median Sale Price | 2026 Trend | PE Activity |
|---|---|---|---|---|---|
| Restaurants (full service) | 2.15x | 0.39x | $220,000 | Flat/Down | Low |
| Coffee Shops / Cafes | 2.21x | 0.46x | $150,000 | Flat | Low |
| Laundromats | 3.65x | 1.33x | $250,000 | Flat | Low |
| Car Washes | 4.99x | 2.01x | $800,000 | Up | High |
| HVAC Companies | 2.79x | 0.59x | $750,000 | Up | High |
| Plumbing Companies | 2.51x | 0.67x | $649,500 | Up | High |
| Electrical Contractors | 2.72x | 0.61x | $1,000,000 | Up | Medium |
| Landscaping / Lawn Care | 2.46x | 0.70x | $425,000 | Up | High |
| Pest Control | 2.40x | 0.99x | $249,000 | Up | High |
| Cleaning / Janitorial | 2.19x | 0.70x | $260,000 | Flat | Low |
| Dental Practices | 2.77x | 0.77x | $350,000 | Flat | High |
| Veterinary Practices | 2.55x | 0.73x | $226,000 | Flat/Up | High |
| Medical Practices | 2.40x | 0.77x | $489,000 | Flat | Medium |
| Accounting / CPA Firms | 2.23x | 1.07x | $424,000 | Flat | Medium |
| Law Firms (small) | 1.96x | 0.72x | $500,000 | Flat | Low |
| Insurance Agencies | 2.86x | 1.52x | $497,500 | Up | Very High |
| Marketing / Digital Agencies | 2.86x | 1.14x | $750,000 | Flat | Medium |
| SaaS (under $3M ARR) | 3.28x to 3.43x | 1.09x to 1.69x | $620K to $950K | Flat/Up | High |
| Ecommerce (FBA/DTC/Shopify) | 3.43x | 1.09x | $950,000 | Flat/Down | Medium |
| Manufacturing | 3.03x | 0.73x | $726,914 | Up | High |
| Auto Repair Shops | 2.83x | 0.64x | $414,000 | Flat | Low |
| Gas Stations | 3.76x | 0.50x | $615,000 | Flat | Medium |
| Convenience Stores | 2.39x | 0.40x | $210,000 | Flat/Down | Medium |
| Daycare / Childcare | 3.27x | 0.86x | $395,000 | Up | Medium |
| Gyms / Fitness Studios | 2.54x | 0.70x | $207,000 | Flat | Low |
| Trucking / Logistics | 3.01x | 0.66x | $1,162,500 | Flat | Medium |
| Staffing Agencies | 2.74x | 0.65x | $670,000 | Flat | Medium |
| Home Health Care | 3.03x | 0.63x | $700,000 | Up | High |
| Pharmacies (independent) | 2.79x | 0.42x | $325,000 | Down | Low |
| Sign / Print Shops | 2.57x | 0.64x | $450,000 | Flat | Low |
| Franchise (general range) | 2.5x to 3.5x | varies | varies | Flat | Medium |
How to Read This Table
Example: Say you own a plumbing company doing $800,000 in revenue with $200,000 in SDE. The average SDE multiple for plumbing is 2.51x. That puts your estimated value at $502,000.
But that is just the starting point. If your plumbing company has a strong maintenance contract base, licensed technicians who will stay post sale, and a management layer so you are not on every job, you could be at the high end of the range (3.08x), putting you at $616,000. If you are a one person operation with no recurring revenue and no systems, you are looking at 1.66x, or $332,000 [8].
The spread between top and bottom of any industry range can be 40% to 100% of the base valuation. That is why the factors driving your multiple matter just as much as the average.
The average multiple tells you where your industry starts. Where you land within the range depends on how you have built and documented your business.
2026 EBITDA Multiples for Larger Businesses
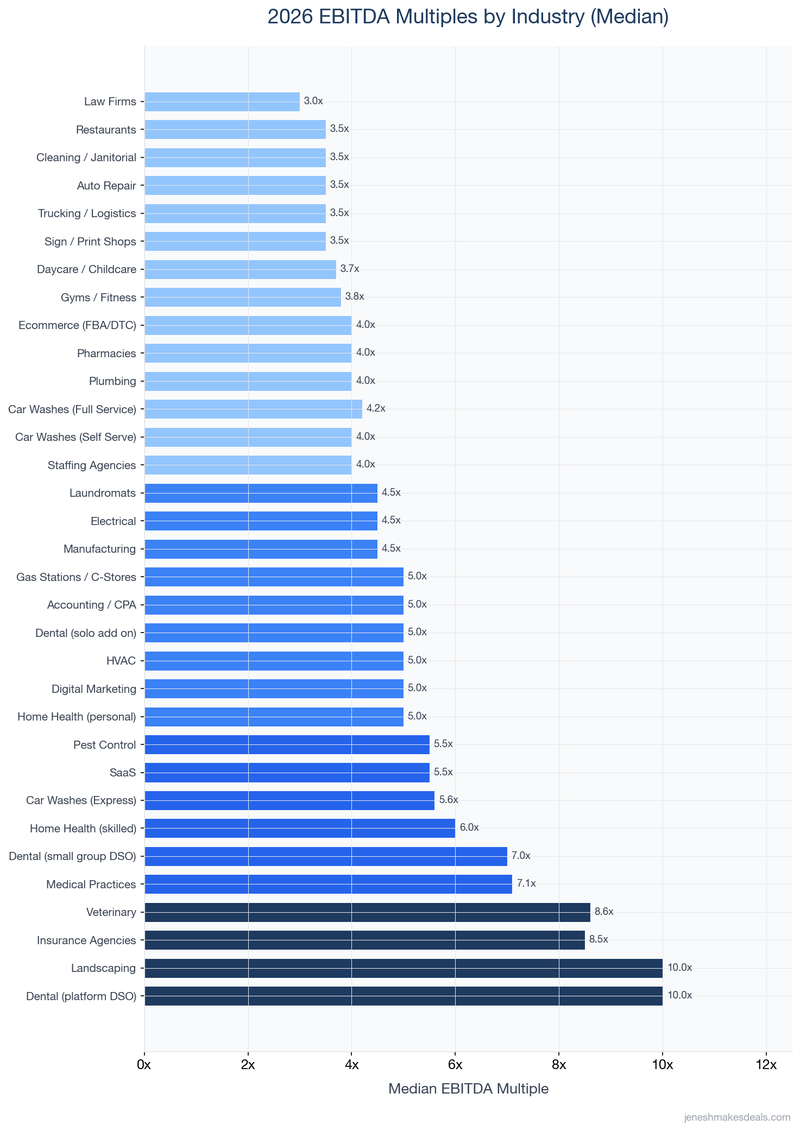
Once your business crosses $1M or more in EBITDA, the buyer pool changes and so do the multiples. PE firms, strategic acquirers, and search funds enter the picture.
| Industry | EBITDA Multiple Range | Median | 2026 Trend | PE Activity |
|---|---|---|---|---|
| Restaurants | 3.0x to 5.0x | 3.5x | Flat/Down | Low |
| Laundromats | 3.5x to 5.5x | 4.5x | Flat | Low |
| Car Washes (Express) | 4.3x to 7.0x | 5.6x | Up | High |
| Car Washes (Full Service) | 3.8x to 5.9x | 4.2x | Flat | Medium |
| Car Washes (Self Serve) | 3.0x to 5.7x | 4.0x | Flat | Low |
| HVAC | 3.4x to 7.8x | 5.0x | Up | High |
| Plumbing | 3.0x to 6.0x | 4.0x | Up | High |
| Electrical Contracting | 3.5x to 6.0x | 4.5x | Up | Medium |
| Landscaping | 7.8x to 12.2x | 10.0x | Up | High |
| Pest Control | 4.0x to 8.0x | 5.5x | Up | High |
| Cleaning / Janitorial | 3.0x to 5.0x | 3.5x | Flat | Low |
| Dental (solo add on) | 4.0x to 6.0x | 5.0x | Flat | High |
| Dental (small group DSO) | 6.0x to 8.0x | 7.0x | Flat | High |
| Dental (platform DSO) | 9.0x to 12.0x | 10.0x | Flat/Down | Very High |
| Veterinary (general) | 5.3x to 11.3x | 8.6x | Flat/Up | Very High |
| Medical Practices | 5.6x to 8.8x | 7.1x | Flat | Medium |
| Accounting / CPA | 3.7x to 7.8x | 5.0x | Flat | Medium |
| Law Firms | 1.8x to 4.5x | 3.0x | Flat | Low |
| Insurance Agencies | 6.2x to 11.8x+ | 8.5x | Up | Very High |
| Digital Marketing Agencies | 4.0x to 7.0x | 5.0x | Flat | Medium |
| SaaS (under $3M ARR) | 4.0x to 8.0x EBITDA | 5.5x | Flat/Up | High |
| Ecommerce (FBA/DTC) | 3.0x to 5.0x | 4.0x | Flat/Down | Medium |
| Manufacturing | 3.6x to 6.1x | 4.5x (SMB) / 6.1x (mid market) | Up | High |
| Auto Repair | 3.0x to 5.0x | 3.5x | Flat | Low |
| Gas Stations / C Stores | 4.0x to 7.0x | 5.0x | Flat | Medium |
| Daycare / Childcare | 3.0x to 4.4x | 3.7x | Up | Medium |
| Gyms / Fitness Studios | 3.3x to 4.3x | 3.8x | Flat | Low |
| Trucking / Logistics | 3.0x to 4.3x | 3.5x | Flat | Medium |
| Staffing Agencies | 2.4x to 5.3x | 4.0x | Flat | Medium |
| Home Health (skilled) | 3.0x to 9.0x | 6.0x | Up | High |
| Home Health (personal care) | 3.0x to 8.0x | 5.0x | Flat | Medium |
| Pharmacies (independent) | 3.6x to 4.8x | 4.0x | Down | Low |
| Sign / Print Shops | 3.0x to 4.5x | 3.5x | Flat | Low |
A note on the landscaping numbers: the 7.8x to 12.2x EBITDA range reflects PE driven transactions for operators with $500K to $10M in EBITDA [9]. If you run a smaller residential landscaping operation, your SDE multiple is closer to 2.46x. I see this confusion all the time. An owner reads about PE paying 10x for a landscaping company and assumes that is what his $300K revenue lawn care business is worth. It is not. The gap between Main Street data and PE data is real, and I break down why below.
Business Size Directly Affects Your Multiple
This is something most owners miss entirely. Your business size does not just affect the total price. It changes the multiple itself.
The IBBA Market Pulse Q3 2025 data shows a clear staircase effect [10]:
| Business Value Tier | Metric | Q3 2025 Median Multiple | YoY Trend |
|---|---|---|---|
| Under $500K | SDE | 2.0x | Flat |
| $500K to $1M | SDE | 2.8x | Up |
| $1M to $2M | SDE | 3.3x | Up |
| $2M to $5M | EBITDA | 4.0x | Flat |
| $5M to $50M | EBITDA | 5.3x to 6.5x | Up |
Peercomps confirmed this pattern across 215 transactions through mid 2025 [2]. In the $1M to $2M range (115 transactions), the median SDE multiple was 3.26x and median EBITDA was 4.06x. In the $2M to $5M range (77 transactions), the average SDE hit 3.65x with EBITDA at 4.09x. In the $5M to $10M range (23 transactions), median SDE reached 4.18x with EBITDA at 4.6x.
The takeaway: growing your business from $500K in value to $2M does not just double the price. It also increases the multiple itself. You get a double benefit.
Example: A cleaning company with $125,000 in SDE sits in the under $500K tier at a 2.0x multiple, valued at $250,000. If that same owner grows SDE to $400,000, the business jumps into the $1M to $2M tier at a 3.3x multiple, valuing it at $1.32 million. The owner grew earnings by 3.2x, but the business value grew by 5.3x.
That math should get your attention.
Ready to talk about your exit? Reach out for a confidential conversation. I respond within 24 hours.
Where Private Equity Is Most Active in 2026
Private equity is the single biggest force shaping business valuation multiples in 2026. When PE enters your industry, multiples go up. When they pull back, multiples stagnate. Full stop.
| Industry | PE Activity Level | Typical PE Premium Over Individual Buyer | Strategy |
|---|---|---|---|
| Insurance Agencies | Very High (72% of deals) | 2x to 4x over individual buyer | Platform + bolt on |
| Dental (DSO) | Very High (100+ active buyers) | 1.5x to 3x (platforms at 10x to 12x EBITDA) | Platform + add on at 4x to 6x |
| Veterinary | Very High | 1.5x to 2.5x (corporate 6x to 8x vs independent 3x to 5x) | Platform + satellite clinics |
| Car Washes | High ($10B+ invested 2019 to 2022) | 1.5x to 2x | Regional roll up |
| HVAC / Plumbing | High | 1.5x to 2x | Multi trade home services |
| Landscaping / Lawn Care | High (75% of home services M&A in 2025) | 1.5x to 2x | Geographic expansion |
| Pest Control | High (becoming more selective) | 1.5x to 2x | Route based roll up |
| Home Health | High | 1.5x to 2x (skilled); 1x to 1.5x (personal care) | Multi branch density play |
| SaaS | High | 1.5x to 3x ARR premium for growth/retention | Platform + product integration |
| Manufacturing | High (onshoring driven) | 1x to 1.5x | Vertical integration |
| Restaurants | Low | Minimal | Franchise only interest |
| Gyms / Fitness | Low | Minimal | Limited |
| Pharmacies (independent) | Low | Minimal | N/A |
Here is something I think a lot of owners do not hear from other brokers. PE firms are "swimming downstream" because lending has tightened [2]. They are targeting smaller, simpler deals or structuring all cash offers. Businesses that were too small for PE two years ago are now getting looks. I have a pest control client in Connecticut with $400K in EBITDA who got two PE inquiries in January alone. That did not happen in 2023.
If your industry has high PE activity, you have more potential buyers competing for your business. In insurance agencies, PE accounts for 72% of all transactions [11]. In landscaping, three quarters of all home services M&A in 2025 was lawn care [12]. That kind of demand pushes multiples up whether you sell to PE directly or not, because individual buyers know they are competing against funded acquirers.
PE firms accounted for 59% of all transactions in the $5M to $50M range in 2025 [2]. If your business is in a PE active industry, you have real negotiating power. Use it.
What Drives Your Business Valuation Multiple High vs. Low
Every table above shows a range. Where you fall is not random. These are the factors that move the needle, ranked by impact.
Recurring revenue is the number one value driver across every industry I work in. I cannot overstate this. Subscription, contract, or maintenance based revenue models consistently trade at 1.5x to 2.5x higher multiples than one time transaction businesses [5][8]. An HVAC company built around maintenance contracts achieves 4x to 6x SDE. The same size HVAC company built around one off installations sees 2x to 4x SDE [8]. On the same revenue, that is the difference between a $400,000 and $800,000 sale price.
Owner dependency is the second biggest factor. If the business cannot function without you, that is a problem for buyers. Every buyer asks the same question: "What happens when this person leaves?" I had a landscaping company owner in Westchester tell me he worked 60 hours a week and ran every crew. His business did $600K in SDE, but the best offer he got was at the bottom of the range because every buyer saw the same thing: the business was him. Businesses with a management layer that runs without the owner trade at the high end. Period.
Financial documentation directly affects price. Clean, audit ready financials and quality of earnings reports yield 20% or more higher valuations [13]. Companies that work with M&A advisors see 23% higher multiples on average. If your books are messy, you are leaving real money on the table before negotiations even start.
Customer concentration compresses multiples. If one client represents more than 20% of your revenue, expect a discount. If one client represents 40% or more, expect a steep discount. Diversified customer bases command premiums across every industry.
Team depth and licenses matter most in regulated industries. Licensed or certified employees who commit to staying post sale significantly increase value in HVAC, plumbing, pest control, dental, and veterinary [8]. If your key technicians walk out the door when you sell, the buyer is buying a shell.
Technology and systems signal scalability. Documented SOPs, CRM systems, automated billing, and route optimization are not just operational improvements. In pest control, HVAC, and landscaping, businesses with digital systems and automation are explicitly preferred by buyers [14][8]. Businesses that can demonstrate AI driven efficiency gains or reduced labor dependency are receiving a 0.5x to 1.5x premium over comparable businesses without these capabilities, particularly from PE and strategic buyers.
So what does this actually mean for your exit? It means the work you do before listing matters more than most owners think. Two businesses in the same industry, same revenue, same city can sell at completely different multiples because one owner invested in systems and prepared for the sale and the other did not.
Thinking about selling? Get a free confidential business valuation with no obligation.
How Interest Rates and SBA Lending Affect Business Valuation Multiples
If you are selling to an individual buyer (not PE), your buyer is almost certainly financing the purchase with an SBA loan. The SBA lending environment directly affects what buyers can afford to pay you.
The prime rate dropped from 7.00% in late 2025 to 6.75% in January 2026, reducing SBA rate caps by 0.25% [3]. That helps, but rates are still elevated:
- SBA 7(a) variable rates: maximum 9.75% to 13.25% depending on loan size [3]
- SBA 7(a) fixed rates: maximum 11.75% to 14.75% depending on loan size [15]
- Average SBA loan amounts are down 38% between May 2021 (when prime was 3.25%) and May 2025 [4]
Higher debt service costs reduce what buyers can finance. That puts downward pressure on prices, especially for businesses valued under $2M where individual SBA backed buyers dominate.
The practical impact is showing up in deal structures right now. Seller financing is no longer a nice gesture. In the $10M to $25M range, equity contributions declined from 41.7% to 36.2%, while senior debt rose to 54.4% [2]. Closing timelines have stretched: average closing time in the $1M to $5M segment is now 8 to 10 months. Due diligence averages 5.5 months in the $5M to $10M segment, a record high [2].
I am seeing this play out in real time. Deals that would have closed in four months in 2021 are taking eight or nine months now. Buyers are pickier. Lenders are pickier. And if you do not have clean financials and a defensible asking price, the deal drags out or dies.
Example: Say a buyer wants to purchase your landscaping business for $425,000 with an SBA 7(a) loan. At a variable rate of 11.5%, their annual debt service on a 10 year term is roughly $72,000. That leaves them about $50,000 in annual cash flow from a business generating $122,000 in SDE. Compare that to 2021, when the same loan at 6.0% would have cost about $57,000 annually, leaving $65,000. That $15,000 per year difference makes buyers more cautious, more likely to negotiate down, and more likely to require seller financing to bridge the gap.
If the Fed continues rate cuts through 2026, pent up buyer demand could release and support or expand multiples. Every quarter point cut puts more buying power in buyers' hands.
Industries Where Multiples Are Expanding in 2026
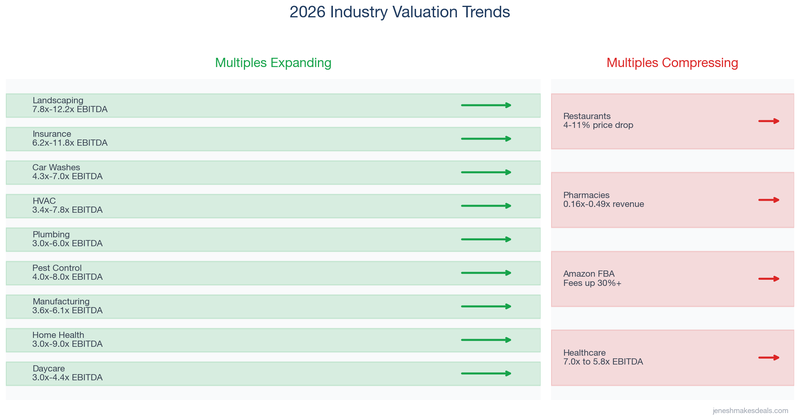
Home Services: HVAC, Plumbing, Landscaping, Pest Control
PE roll up strategies continue to drive consolidation across all four industries. HVAC EBITDA multiples reach 7.8x at the top end [8]. Plumbing EBITDA multiples go up to 6.0x. Landscaping is seeing PE driven EBITDA multiples of 7.8x to 12.2x for larger operators [9].
The landscaping shift is dramatic: three quarters of home services M&A tracked by PCO Bookkeepers in 2025 were in lawn care [12], a massive shift from prior years dominated by pest control. If you own a landscaping business with $1M or more in EBITDA and you have not talked to a broker yet, you are leaving opportunity on the table. Not sure what a broker actually does? Here is a breakdown of a business broker's role in selling your company.
Insurance Agencies
Insurance agency multiples have expanded 29% since 2020, from 9.4x to 12.1x EBITDA [11]. Sica Fletcher reports an average of 11.8x EBITDA for H1 2025 transactions with $1M or more in EBITDA [11]. Capstone Partners reports the Insurance Distribution segment averaging 16.7x EV/EBITDA from 2022 through 2025 [6]. With PE accounting for 72% of all agency transactions and over 50 active consolidators competing, buyer competition has prevented multiple compression even with elevated borrowing costs.
This is one of the hottest seller's markets I have seen in any industry. The demand is real and it is sustained.
Car Washes (Express Model)
Express exterior car washes saw a 1.4x increase in EBITDA multiples since Q1 2020 [7]. The industry attracted over $10 billion in PE and family office investment from 2019 to 2022 [7]. EBITDA margins of 45% to 65% for express washes, combined with subscription/membership models, make this a PE favorite. The industry remains highly fragmented with no dominant national chains, making it a prime roll up target. If you own a car wash in a high growth market, the current valuation data for car wash sellers is worth studying closely.
Manufacturing (Onshoring Aligned)
The $5M to $10M segment saw manufacturing as the strongest performer, with median sale prices up 54% in 2025, driven by onshoring trends and tariff impacts [2]. GF Data reports manufacturing holding steady at 6.1x EBITDA in the mid market [2]. Business services jumped from 6.3x to 7.8x EBITDA, the sharpest increase of any mid market sector [2].
Industries Where Multiples Are Compressing in 2026
Not every industry is trending up. If you are in one of these sectors, you need to be realistic about where things are headed.
Restaurants and Retail
Restaurants and retail have seen 4% to 11% drops in median sale prices in 2025 [2]. As Calder Capital's Managing Partner put it, "that market seems all but dead right now" [2]. Full service restaurants average just 2.15x SDE with a revenue multiple of 0.39x. Discretionary spending contraction, labor cost pressure, and minimal PE interest all work against sellers.
Here is my honest take: if you own a full service restaurant and you are thinking about selling, your window is not great. The buyer pool is thin. Most buyers with capital are looking at industries with better margins and less operational headache. That does not mean it is impossible, but your expectations need to match reality.
Pharmacies
Independent pharmacies face continued PBM margin pressure, competition from mail order and online pharmacies, and sector uncertainty from the Walgreens/Sycamore restructuring [6]. Revenue multiples are notably low at 0.16x to 0.49x, reflecting thin margins [6].
Amazon FBA and Ecommerce
Rising FBA fees (up 20% to 30% in 2023 and 12% more in 2024) are compressing margins and impacting exit prices [6]. Pure Amazon FBA plays are most exposed. DTC brands with owned channels and subscription revenue models are more resilient, but the overall trend is flat to down.
Healthcare (Mid Market)
GF Data reports healthcare multiples dropping from 7.0x EBITDA in 2024 to 5.8x in 2025 [2]. Regulatory pressure, Medicare rate uncertainties, and struggles at PE backed platforms are all contributing.
Mid Market EBITDA Multiples: What PE Firms Are Paying
GF Data tracks PE sponsored transactions in the $10M to $500M total enterprise value range. Their Q3 2025 data reveals clear sector trends [2].
| Sector | 2024 EBITDA Multiple | 2025 EBITDA Multiple | Direction |
|---|---|---|---|
| Manufacturing | 6.1x | 6.1x | Flat |
| Business Services | 6.3x | 7.8x | Up significantly |
| Distribution | 6.6x | 7.6x | Up |
| Healthcare | 7.0x | 5.8x | Down significantly |
Average purchase price multiples rose to 7.5x trailing EBITDA in Q3 2025 [2]. For companies with above average financial performance, the premium averaged 7.5x in the $25M to $50M segment and 8.8x in the $50M to $100M segment [2].
The size premium between large ($100M to $500M total enterprise value) and smaller platforms (sub $100M) expanded to 2.8x in the first nine months of 2025 [2]. Deals in the $3M to $5M EBITDA range held at 6.4x, while deals with EBITDA over $10M rose from 7.7x to 8.1x [2].
If your business has $3M or more in EBITDA and is in business services or distribution, the market is paying a premium right now. If you are in healthcare, the window has tightened considerably.
What to Do Next
You have the data. Here is how to use it.
-
Find your industry in the tables above and identify your multiple range. Do not just look at the average. Understand the full range and honestly assess where you fall based on recurring revenue, owner dependency, financial documentation, customer concentration, team depth, and technology.
-
Calculate your baseline valuation. Take your trailing twelve month SDE (if under $3M revenue) or EBITDA (if over $3M revenue) and multiply by the median multiple for your industry. Adjust up or down based on value drivers.
-
Get a professional valuation before you list. The numbers in this post are market averages. Your business has specific strengths and weaknesses an experienced business broker can quantify. Companies that work with M&A advisors see 23% higher multiples on average [13]. That is not a sales pitch. It is data.
-
Understand your buyer pool. If your industry has high PE activity, you have more potential buyers and more negotiating power. If PE is absent, your buyer is likely an individual using SBA financing. Price accordingly and be prepared to offer seller financing.
-
Time your exit with market awareness. If your industry multiples are expanding (home services, insurance, manufacturing), the market is working in your favor. If they are compressing (restaurants, pharmacies, Amazon FBA), weigh whether waiting will improve or worsen your position.
March 2026 note: Three months into 2026, the trends above are holding. Home services multiples remain elevated as PE platforms push for add on acquisitions ahead of fund exits. SBA 7(a) rates have stabilized in the 9.75% to 14.75% range but remain high enough to constrain individual buyer purchasing power on smaller deals. If you are an owner in a high PE activity industry (HVAC, plumbing, landscaping, car washes, insurance), the window is still open but narrowing as more sellers enter the market.
Here is the thing most owners get wrong: they wait too long. They think the market will get better or their business will magically become more attractive. But the data shows that preparation, not timing, is what drives premium exits. Start the work now. Get your financials clean. Build that management layer. Document your systems. The owners who do this before they list are the ones who sell at the top of the range.
Want to know what your business is worth? Start with a free valuation and I will walk you through the numbers.
Caveats About This Data
Multiples are ranges, not guarantees. Every business is unique. A specific business can trade above or below the ranges listed based on dozens of qualitative and quantitative factors.
Data source differences matter. BizBuySell captures smaller Main Street transactions (often sub $1M). First Page Sage, GF Data, and Peercomps capture larger, often PE driven transactions. This explains why EBITDA multiples from PE focused sources appear much higher than BizBuySell SDE multiples for the same industry.
SDE and EBITDA are not directly comparable. SDE includes the owner's salary (typically $75,000 to $200,000 or more), so SDE multiples will always appear lower than EBITDA multiples for the same business.
Most hard transaction data in this post extends through Q3 2025. Forward looking statements about 2026 trends are based on Q3/Q4 2025 trajectory data, expert commentary, and macroeconomic indicators. This post was last reviewed and updated in March 2026 to ensure all multiples and trend data remain current.
PE "headline" multiples can be misleading. The highest multiples (10x or more EBITDA) typically apply only to platform deals by PE firms, not to individual buyers. Add on acquisitions by the same PE firms often happen at 3x to 6x EBITDA. The effective blended multiple is much lower.
This post was compiled using transaction data from BizBuySell, IBBA Market Pulse, Peercomps, GF Data, First Page Sage, Flippa, Calder Capital, Sica Fletcher, Capstone Partners, PitchBook, Peak Business Valuation, Scope Research, Axial, PwC, McKinsey, and SBA lending data from Lendio and NerdWallet. Data spans Q1 2021 through Q4 2025, with SBA lending data current through February 2026.
Try our free business valuation calculator to estimate what your business might be worth based on the multiples in this post. Have questions about your specific situation? Let's talk.
Sources
[1] BizBuySell, "2025 Year in Review: BizBuySell Market Recap," bizbuysell.com
[2] Calder Capital, "Q2 2025 Mergers & Acquisitions Activity on Deals from $1M to $100M," caldergr.com
[3] Lendio, "Current SBA Loan Interest Rates January 2026," lendio.com
[4] Bankrate, "How The Federal Reserve Affects Business Loans," bankrate.com
[5] First Page Sage, "EBITDA Multiples for Small Businesses 2025," firstpagesage.com
[6] David Jacobs Business Broker, "Business Valuation Multiples by Industry (2025 Guide)," davidjacobsbusinessbroker.com
[7] BizBuySell, "Business Valuation Multiples by Industry: Revenue & Earnings (SDE)," bizbuysell.com
[8] ClearlyAcquired, "What is a Multiple and How Does it Determine Your HVAC or Plumbing Business Value," clearlyacquired.com
[9] First Page Sage, "EBITDA Multiples for Landscaping Companies: 2025 Report," firstpagesage.com
[10] IBBA, "Q3 2025 Market Pulse Highlights," ibba.org
[11] Sica Fletcher, "2025 Insurance Broker M&A Valuations," sicafletcher.com
[12] PCO Bookkeepers, "With Lawn Care Valuations on the Rise, Should You Hold or Sell?" pcobookkeepers.com
[13] First Page Sage, "Healthcare EBITDA & Valuation Multiples: 2025 Report," firstpagesage.com
[14] Lion Business Advisors, "Pest Control Industry Update Q1 2025," lionbusinessbrokers.com
[15] NerdWallet, "SBA Loan Rates 2026," nerdwallet.com
Related Articles

April 30, 2026
How Long Does It Really Take to Sell a Business
Most sellers are shocked by how long it takes. Here's the honest timeline from listing to closing, and what actually speeds things up.

April 26, 2026
How to Structure an Earnout That Works for Seller and Buyer
Most earnouts fail because they're poorly structured. Here's how to build earnout terms that protect both sides of the deal.

April 24, 2026
How to Value Intellectual Property in a Business Sale
Your IP could be worth more than your equipment. Learn how patents, trademarks, and trade secrets affect your business valuation.
About the Author
Jenesh Napit is an experienced business broker specializing in business acquisitions, valuations, and exit planning. With a Bachelor's degree in Economics and Finance and years of experience helping clients successfully buy and sell businesses, he provides expert guidance throughout the entire transaction process. As a verified business broker on BizBuySell and member of Hedgestone Business Advisors, he brings deep expertise in business valuation, SBA financing, due diligence, and negotiation strategies.
You might also be interested in
Free Business Calculators
Try our business valuation calculator and ROI calculator to estimate values and returns instantly.
How to Buy a Business Guide
Download our comprehensive free guide covering everything you need to know about buying a business.
Our Services
Explore our professional business brokerage services including valuations and buyer representation.
More Articles
Browse our complete collection of business brokerage insights and expertise.